
The outdoor market intelligence service (OMIS) provides near real-time sell out data analytics for the European Outdoor industry.
OMIS is the first European sell-out panel with data supplied directly from the market. The product taxonomy, categorisation and filter set was created by European outdoor brands and retailers.
This is data by the industry, for the industry. For that reason, OMIS is endorsed by the European Outdoor Group (EOG), Outdoor Industry Association (OIA), Outdoor Sports Valley (OSV), OUTTRA, and Snowsports Industries America (SIA).
OMIS operates in the UK, France, and DACH.
WHO CAN TAKE PART?
Sales Data Contributors: A retailer (online, e-commerce, bricks & mortar) or a Brand (D2C sales) providing sell-out data to the OMIS panel. As a Data Contributor, you gain access to Market and Retail data for free.
Data Subscribers: A Brand, Retailer or Distributor who wants to see Brand Performance data. Data Subscribers gain access to Market, Retail, Brand and Product level data. Brands can see their own SKU product level data, across the market.
WHAT ANALYTICS ARE OFFERED?
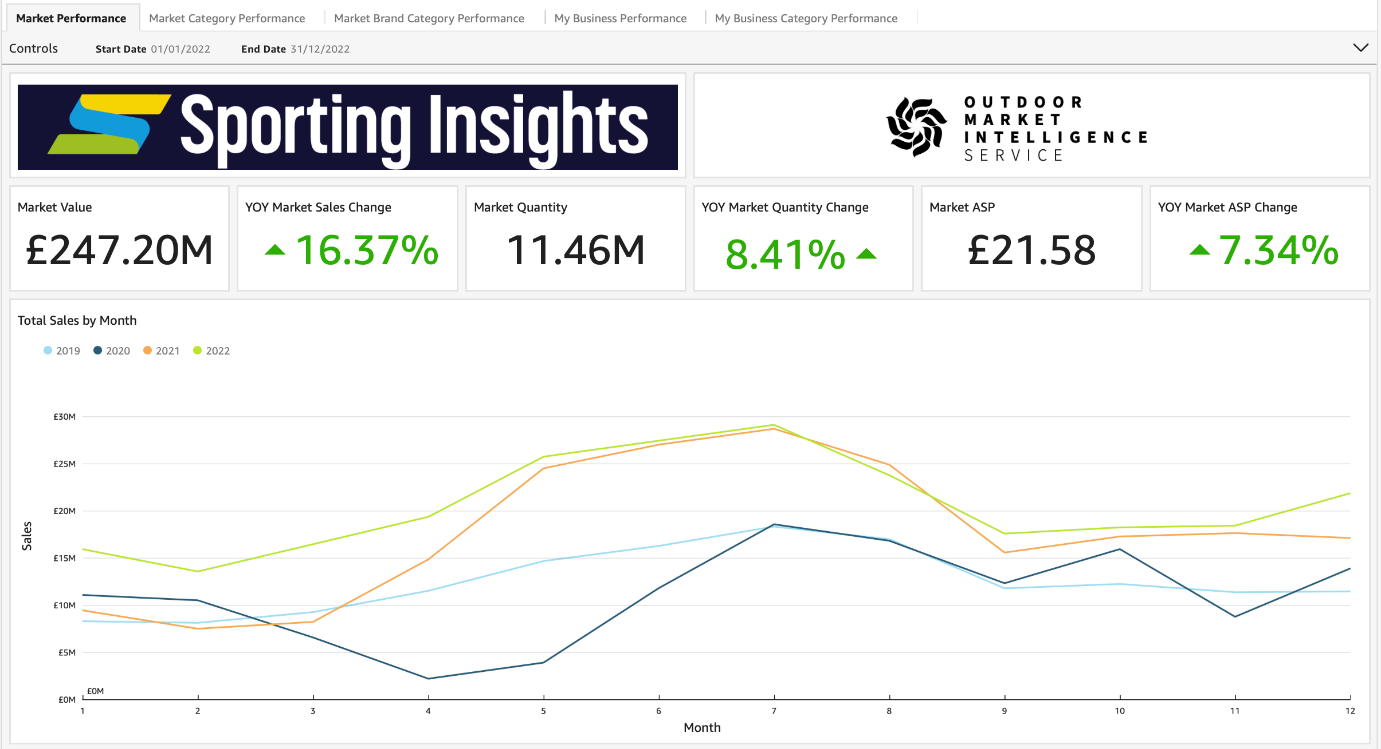
The OMIS Dashboard provides powerful market intelligence to support smarter business decisions. It delivers detailed insights across three key departments: Apparel , Footwear, Equipment (including Camp & Kitchen, Bags & Luggage, Verticality, Winter Sports). This allows users to analyse performance at the Department, Category and Sub-Category level. Businesses can track Market, Retail and Brand performance, identify top-performing brands, and monitor key metrics such as value, units, and average sales price.
With these insights in one place, OMIS equips businesses with the intelligence needed to spot opportunities, track competition, and make incisive, data-backed decisions.
WHY MARKET INTELLIGENCE?
Identify opportunities in the market
Market Intelligence helps businesses understand customer needs, preferences, and buying behaviour, letting them act fast on new trends, customer segments, and habits.
Boost company performance
Market Intelligence allows for competitive analysis and helps companies position themselves more effectively.
Overcome market challenges
Market Intelligence can be used as an early warning system. Making decisions based on reliable market data reduces uncertainty. Misreading emerging trends, overlooking new audiences, and overestimating demand can lead to costly mistakes and unsustainable practices.
Assess investment strategy
Test assumptions about the market and do due diligence before investing in new markets and categories.
WHY OMIS?
Built by trusted partners
OMIS is centralized, trusted data. As neutral bodies, the EOG and Sporting Insights can collect, aggregate, and anonymise the data using tried and trusted technology stacks.
Reduce business risk
Data is critical to business health. To reduce risk and increase sustainable investments in the European outdoor industry, the sector needs to foster a collaborative, pre-competitive data environment built on trust.
Industry expertise
Policy and advocacy support
With more accurate data, the EOG can properly promote and defend the outdoor industry at the EU level. This supports funding applications and more, a rising tide that raises all boats.
HISTORY
The outdoor industry was built by enthusiasts who turned their passions into profitable businesses. The pervading industry culture valued authenticity and intuition, sometimes over formal market analysis. Often, businesses relied on intuition and experience to guide decision making.
Over time, the market has grown more complex and competitive. Today, the outdoor sector covers diverse activities – each with unique audiences and distribution channels. This fragmentation makes it difficult to collect comprehensive data or identify clear, industry-wide patterns. Institutional knowledge and insider intuition often fill the gap.
Until recently, European outdoor industry data was limited. Without structured data sources or intelligent tools, companies made decisions based on anecdotal evidence from retailers, trade shows, and personal experiences.
As the industry continues to mature and become more competitive, assumptions and gut-instinct are not enough. Now, with OMIS, the European outdoor industry can make informed, data driven decisions.
PARTICIPANTS
PRICING
We are currently offering Trial Pricing for subscribers – available for 6 months until 1st October 2026.
Data contributors
FREE
If you contribute your D2C sales to the panel, then you receive Market and Retail analytics back for free. This includes Market and Retail Volume, Value and ASP relative to relevant Category or Sub-Category by period and channel to support commercial decisions.
For Brand and Product level data, there is a cost associated.
Data Contributors can become Data Subscribers to see the highest level of detail available in OMIS.
- Market and retail analytics via the bespoke dashboards
- All datasets are anonymised and stored securely to HITRUST and ISO27001 certification standards
- Fully automated system after initial setup via SFTP
- Multiple currency options
- Data updated monthly using data from all contributors
Data subscribers
€1000-3,500/ per month
Data Subscribers can view Market, Retail, and Brand performance in relation to Volume, Value and ASP relative to the relevant Category or Sub-Category by period and channel. Brands that subscribe can also see their own product sales across the market, at the SKU level.
TRIAL PRICING OPTIONS*:
- All Departments DACH Service Only €2500 per month
- All Departments DACH & UK Service €3500 p/m
- Either 1 Category or 4 Sub-Categories, DACH Service Only €1000 p/m
- Either 1 Category or 4 Sub-Categories, DACH & UK Service €1500 p/m
*All prices per month. Minimum 3 month rolling contract. Subscribers will receive logins to allow three simultaneous users to access the dashboard, a training program for up to 4 participants, and access to an office hours support desk. Subscribers who participate in the trial for 3 months will automatically secure a discount of 20% on the service prices from 1st October. These prices will be finalized by 31st August 2026. Costs are exclusive of VAT.
FAQ
No. All data is aggregated and no individual retailer can be identified. Only the individual retailer/D2C brand will be able to identify and have access to their own sales.
All the data we receive is secure with server-side encryption in our Amazon s3 storage layer. Data is uploaded to Amazon s3 using our SFTP service. Each data provider will have a dedicated area for the secure storage of their data, accessed through use of a private key and password. Data is processed in snowflake which meets HITRUST and ISO27001 certification standards. Data visualisation access is through Amazon QuickSight and managed through row level security, ensuring that the Provider’s data is visible only to the appropriate parties.
The dashboard will be updated every month with the previous month’s data.
We have collected data from 2019 onwards, pre-Covid, to allow year on year comparisons from day one.
Free access is only granted to those providing Sales Data. The level of reporting functionality is limited to market level data.
Paid access allows users to delve deeper to SKU-level data, market share comparisons, and filtering options that will continue to be added on an ongoing basis. Subscriptions are priced according to the depth and breadth of data accessed.
There are various ways to share data with us:
- Where possible we work with EPOS providers, who with the permission of the retailer, we are able to access the data directly from them.
- Set up a secure SFTP location for you to upload your data.
- Access via an API.
Data contributors receive one login. Data subscribers receive three separate logins.
Additional logins can be purchased for £100 per annum.
Yes. The service is supported by major industry associations including the EOG, OIA, OSV, and OUTTRA. It is supported by both brands and retailers, delivering subscribers competitive advantage while also helping to raise all boats across the industry.